Debugging
Run, Pause, Reboot
In debug mode, your target can be in one of four states: RUN, PAUSE, BREAK, and ABORT. See Target States, Exceptions for more information.
 The RUN state is entered by pressing [F5] or selecting Debug > Run.
 The PAUSE or BREAK states are entered when you do Debug > Pause. In addition, the VM will BREAK on reaching a breakpoint.
 Debug > Restart reboots the target. Execution of the application will not start automatically: The target will emerge in the PAUSE state and wait for you to hit [F5].
Breakpoints
Breakpoints are pausing places in your code. To toggle (set/clear) a breakpoint, click on the gray border on the left side of the source code pane.
You can also press [F9] to toggle a breakpoint on the line on which your | cursor is located. Of course, there is a menu item as well: View > Breakpoints displays a handy Breakpoints pane.
A breakpoint may be placed only on a line that contains executable code. Before you compile your project, you can place breakpoints anywhere. On compile, a breakpoint placed on a line containing no executable code will be shifted down to the nearest code-bearing line.
You can toggle breakpoints at any time — even when the target is executing (RUN).
Every breakpoint slightly reduces the execution speed.
Program Pointer and Stack
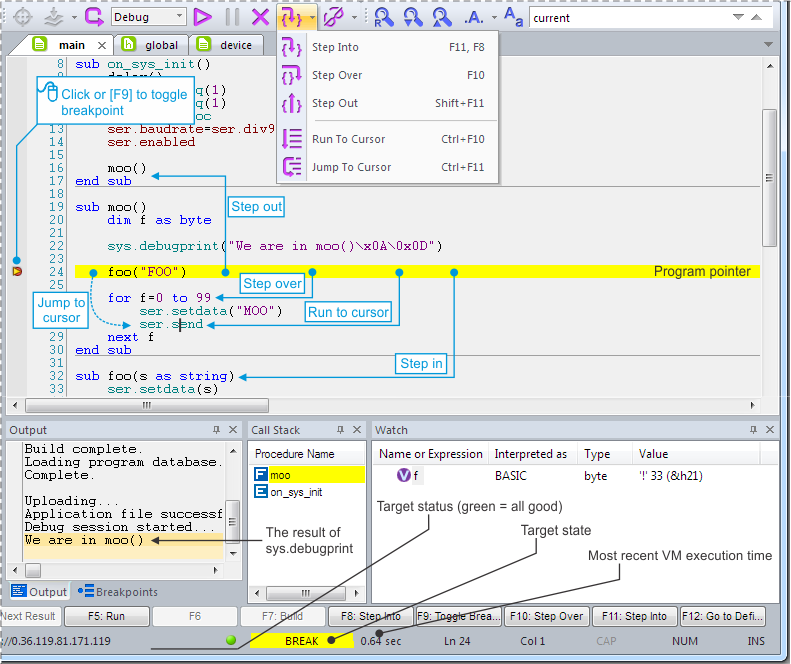
Whenever your target is in the BREAK state, TIDE shows the program pointer. This is a bright yellow line (and a small triangle on the left) that highlights the next line to be executed.
Another kind of highlighting — in blue — shows program locations that are currently on stack. The blue highlight is shown on the line that is to be executed next after control returns to the corresponding procedure.
View > Call Stack displays the Call Stack pane and the current "nesting" of procedures.
Profiling
 Whenever execution stops, TIDE displays the amount of time elapsed since the execution began or resumed. This allows you to profile your applications (i.e., measure the amount of time various parts of code take to execute.
"Step-by-Step" Debugging
Here is what's possible when the target is in BREAK:
 [F8] or Debug > Step Into executes the line on which the pointer is located. If the current line calls up a procedure, you will "step into" it. This is the way to execute the smallest possible portion of your program.
On some rare occasions, stepping won't work. For example, you cannot step through an infinite loop (e.g., label1: goto label1). Pressing [F8] here is like pressing [F5].
 [F10] or Debug > Step Over is like "step into," but if the current line calls up a procedure, the entire procedure will be executed. Execution will stop on the next line after the procedure call.
This helps you "concentrate" on the current procedure without delving into trifle details of what subordinate procedures are doing.
 [SHIFT]+[F11] or Debug > Step Out runs until the end of the current procedure. Execution will stop on the next line after the line that called up this procedure.
 [CTRL]+[F10] or Debug > Run to Cursor executes all code from the program pointer to the line where your cursor is currently located.
 [CTRL]+[F11] or Debug > Jump to Cursor skips all the code between the program pointer and the line where your cursor is currently located — no execution takes place.
This is a very cool feature that allows you to try things when debugging.
Watch List
 Whenever your target is in the PAUSE or BREAK states, you can inspect variables and object property values.
Use Debug > Add to Watch List to add an expression to the Watch pane (View > Watch). Notice the use of the word expression. That's for a reason — the Watch pane can do much more than just show you variable values.
There are also Watch tooltips — just mouse over a variable or an object property to inspect its value. However, this doesn't work for arrays, structures, and unions — these can only be inspected in the Watch pane.
Tooltips also work in the Browser-Project and Browser-File panes.
When using watch tooltips, be mindful of the current scope (context).
Locals
Whenever your target is in the BREAK state, the Locals pane automatically shows you the current values of all local variables visible in the current scope.
Debug Printing
Use the sys.debugprint method to send messages from your application to TIDE's Output pane (View > Output). This is very useful for execution tracing:
...
sys.debugprint("Branch 1\x0D\x0A")
...
sys.debugprint("Point 1, x="+str(x)+"\x0D\x0A") 'Send along the current value of x
...
As execution of the application proceeds, the Output pane will catch debug messages from your device:
Point 1,x=10
Target Communications Status
During debugging, the status bar at the bottom of the window shows you the state of communications with the target:
 The green circle is moving from side to side: all is good — the target is responding.
 The yellow circle isn't moving or moving slowly and sporadically: something might be wrong.
 The circle is red and not moving at all: lost the target!
Finishing Debugging
 Press [ESC] or select Build > Stop Build/Upload/Debug to exit debug mode completely. Exiting doesn't affect the execution state of the target.