Watch Pane
View > Watch to show/hide this pane. See also: Debugging
![]() This pane has an associated TIDE Preferences page (File > TIDE Preferences —> IDE —> Watch and Locals).
This pane has an associated TIDE Preferences page (File > TIDE Preferences —> IDE —> Watch and Locals).

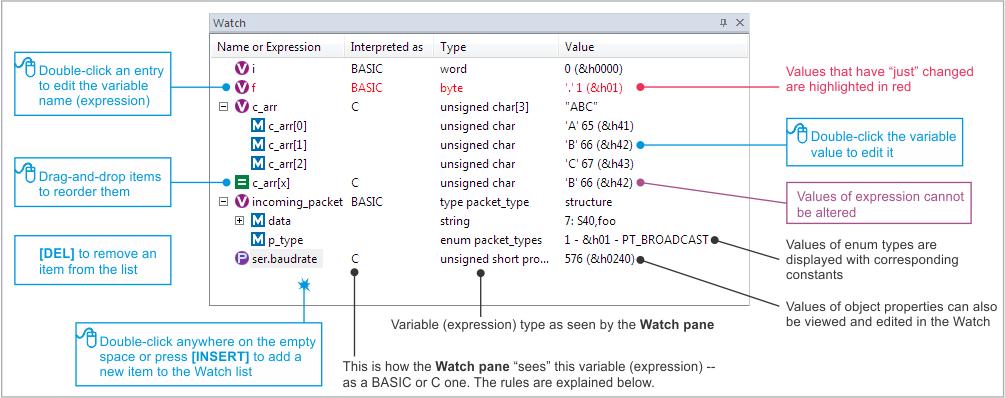
The watch list can contain variables, as well as expressions. The ability to evaluate expressions is extremely useful. For example, you can enter c_arr[f] and this will show you the value of the member f of array c_arr.
There are several ways in which you can add an entry to the list:
 Select Debug > Add to Watch List
- In the source code, right-click on a variable and select Add to Watch List
- Double-click anywhere on the empty space in the Watch pane
- Press [INSERT] while the Watch pane has focus
You can drag-and-drop list entries to reorder them.
To edit an entry, double-click the variable name (or expression) in the Name or Expression field.
Variable and expression values are updated each time the VM exists the RUN state. Entries whose value has changed since the last update are highlighted in red. For enumeration types, values are displayed with corresponding constants.
Variable values can be altered directly from the Watch pane — to achieve this double-click on the current value and edit it.
Expression values cannot be altered from the Watch pane.
The values of object properties can also be viewed and edited in the Watch pane.
Scopes in Watch
If the VM is in BREAK (i.e., you are inside some executable code), the Watch looks at the list of variables in the Watch pane from the point of view of the context (scope) of the (yellow) execution pointer.
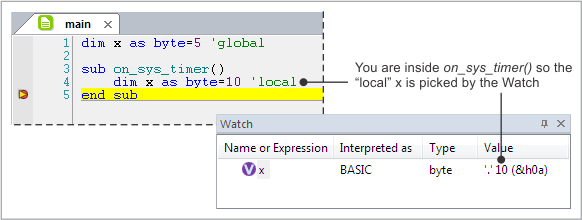
Here is an example: you are currently inside the on_sys_timer event handler, which has a variable x. There is also a global variable with the same name. Since the execution pointer is inside the handler, the Watch pane will interpret the entry x as referring to the local scope of the on_sys_timer.

It's quite easy to get confused with various scopes when using watch tooltips.
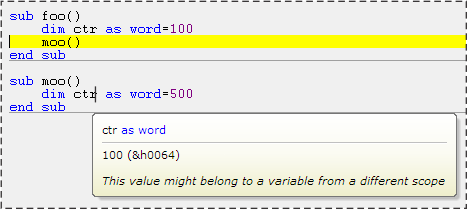
Let's say you code has two procedures, and both have a local variable f. The (yellow) execution pointer is in foo(), and you mouse over a variable with the same name in moo().
What do you get? Still the value of f from foo(), even though your mouse is at a different procedure. This is because this is the current local scope — f from moo() doesn't actually exist at this moment!
TIDE will even warn you by adding this message: This value might belong to a variable from a different scope.

If the VM is in PAUSE (i.e., no code is being executed), the Watch only has the global scope to work with.
Scope Switching With the Call Stack Pane
Double-clicking on any entry in the Call Stack pane teleports you to a corresponding place in the sources (displayed with a blue highlight) and also changes the scope used by the Watch. That is, the Watch scope switches to the scope of the location you double-clicked in the Call Stack pane.
Rules of Tibbo BASIC or C Expression Interpretation
The Watch pane is, necessarily, bilingual. It understands both Tibbo BASIC and C.
Simple variable types are compatible between Tibbo BASIC and C. An unsigned char variable in C is called a byte variable in BASIC. Both refer to the same data type.
If the execution is on BREAK inside the Tibbo BASIC code, the Watch looks at simple variables (and expressions involving just simple variables) from the Tibbo BASIC point of view. For a simple variable, the Interpreted as field will indicate BASIC, and the Type field will use Tibbo BASIC notation to express this variable's type (i.e., byte, char, word, and so on).
If the BREAK happens inside the Tibbo C code, the Watch looks at simple variables (and expressions involving just simple variables) from the Tibbo C point of view. For the same simple variable, the Interpreted as field will show C, and the Type field will use C notation (i.e., unsigned char, char, unsigned int, etc).
The above is true even for global simple variables. Even if such a variable is defined in Tibbo C, it will be "interpreted as" a Tibbo BASIC variable if the execution BREAKs inside the Tibbo BASIC code (and vice versa).
If the execution in on PAUSE , meaning that no code is being executed at all, the Watch can't use the above rule to set the interpretation mode for simple variables. Instead, the Watch will use the current | cursor location as the reference.
If the currently opened source file is a Tibbo BASIC file, the Watch will use the Tibbo BASIC interpretation. If the currently opened source file is a Tibbo C file, the Watch will use the Tibbo C interpretation.
The situation is different for arrays, structures, and unions.
Tibbo BASIC arrays and types (structures of BASIC) are incompatible with arrays and structures of Tibbo C. There is no C interpretation for them.
For such variables and expressions involving them, the Watch will always use the only interpretation available. For Tibbo BASIC arrays and types (and expressions involving them) the Watch will always use the BASIC interpretation. For Tibbo C arrays, types, and unions (and expressions involving them) the Watch will always use the BASIC interpretation.
Here is an interesting example.
An array variable c_arr is defined in Tibbo C, and the execution is currently paused in Tibbo BASIC code.
You want to add the Watch entry showing the value of the member f of array c_arr.
What should you type — c_arr(f) as required by Tibbo BASIC or c_arr[f] as done in Tibbo C? The Tibbo C version is correct!
Because c_arr is defined in Tibbo C (BASIC does not understand C arrays), the Watch will interpret this expression as the C expression. Hence, you need to use the C syntax to reference an array member.
The entry will continue showing the C interpretation no matter where the execution BREAKs.
