Call Stack Pane
View > Call Stack to show/hide this pane. See also: Debugging
The Call Stack pane only shows stack contents when the VM is in the BREAK state.
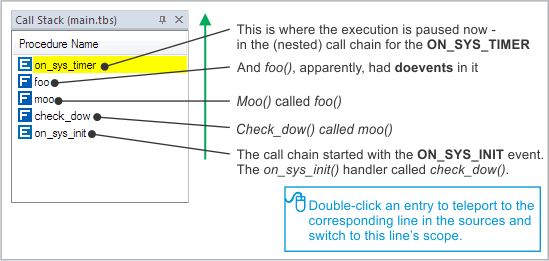
The stack should be viewed bottom-to-top, meaning that the older (deeper) the procedure is, the lower it is in the list.
Double-clicking on any entry in the call stack teleports you to a corresponding place in the sources (displayed with a blue highlight) and also changes the scope used by the Watch. That is, the Watch scope switches to the scope of the location you double-clicked in the Call Stack pane.
The screenshot above shows five calls on stack. There are two call chains involved. Everything started with the ON_SYS_INIT event. Procedure foo(), apparently, had the doevents statement in it because a different chain (for the ON_SYS_TIMER event) has started before the ON_SYS_INIT chain completed execution.