Breakpoints Pane
View > Breakpoints to show/hide this pane. See also: Debugging
Breakpoints are pausing places in your code.
This pane shows all breakpoints set in your project. Up to 16 breakpoints can be set at any given time.
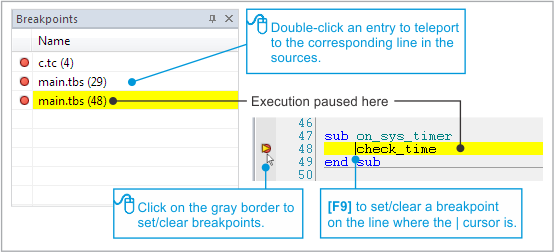
If the execution pauses at a certain breakpoint, this breakpoint is highlighted in the list.
Double-clicking on any entry in the list teleports you to a corresponding place in the sources.
To toggle (set/clear) a breakpoint, click on the gray border on the left side of the Editor pane. You can also press [F9] to toggle a breakpoint on the line where your | cursor is located. Of course, there is also a menu item as well.
 A breakpoint may be placed only on a line which contains executable code. Before you compile your project you can place breakpoints anywhere. On compile, a breakpoint placed on a line yielding no executable code will be shifted down to the nearest "code-bearing" line.
You can toggle breakpoints at any time — even when the target is executing ( RUN ).
Each additional breakpoint slightly reduces the execution speed.
To clear all breakpoints, select Debug > Remove All Breakpoints.