Debugging
The application is presumably working, so there is nothing to debug, really. Still, let's use this starter project to learn the basics of debugging.
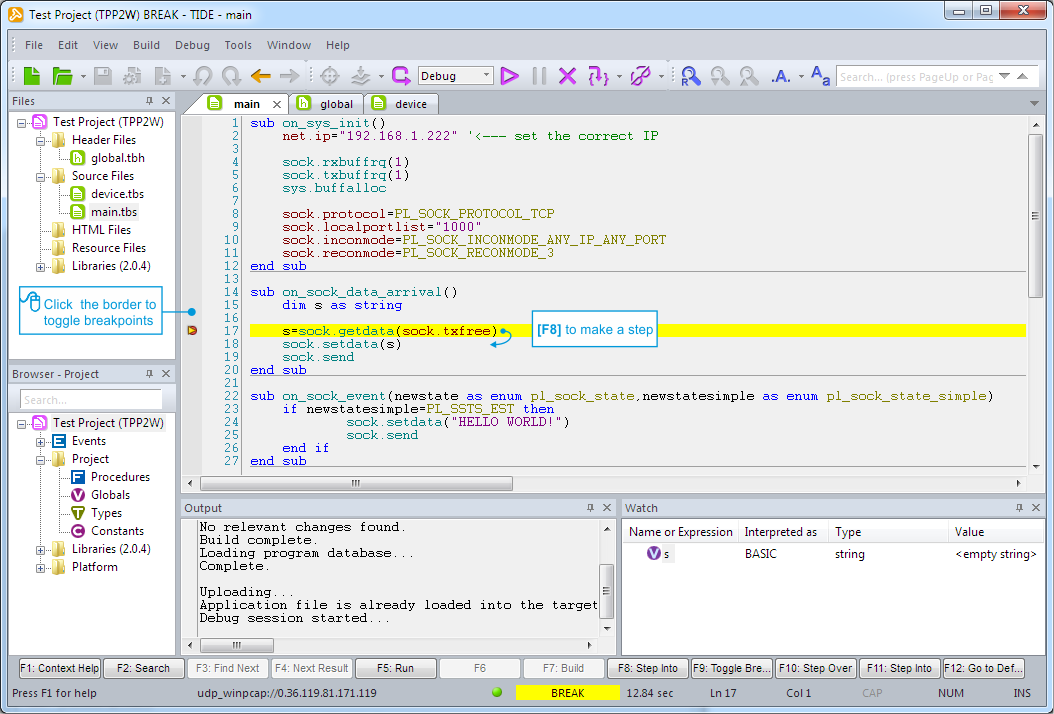
Place a breakpoint on the s=sock.getdata(sock.txfree) line. To do so, double-click on the empty border to the left of this line. A small red circle will appear there. That's your breakpoint.
Breakpoints can also be "toggled" (added/removed) by pressing [F9].
Press [F5] if you haven't yet started the execution.
Send something from IO Ninja. The execution will BREAK at your breakpoint.
 Now select Debug > Add to Watch List and add the variable s to the watch. In this application, all received TCP data passes through the s variable.
At first the variable is empty — this is because the "yellow line" (the execution pointer) hasn't been executed yet.
- Press [F8] to execute a single line of code. The yellow line will move, and the Watch pane will show you the new value of s. It will contain the string you've sent from IO Ninja.
- Press [F5] to resume the execution.